Kansas City Multifamily Market Overview
Q3 2025 Presentation Handout
2025 Year in Review
2025 was an exceptional year for the Kansas City Multifamily team. Highlight total transaction volume, number of assets closed, and total units transacted. This sets the stage for the market overview that follows.
2025 Closed Transactions
Showcase of our top 12 closed transactions in 2025. Each property represents successful execution and market expertise. Note the diversity of submarkets and price points, demonstrating our comprehensive market coverage.
Team & Performance
Introduce the team leadership and support staff who made 2025 successful. Year-over-year comparison shows growth trajectory and market momentum. Emphasize team depth and collaborative approach.
Market Overview Cover
Transition from team performance to broader market analysis. Welcome to the Kansas City Multifamily Market Overview for Q3 2025. This section covers market fundamentals, submarket analysis, national comparisons, and investment opportunities in the KC metro area.
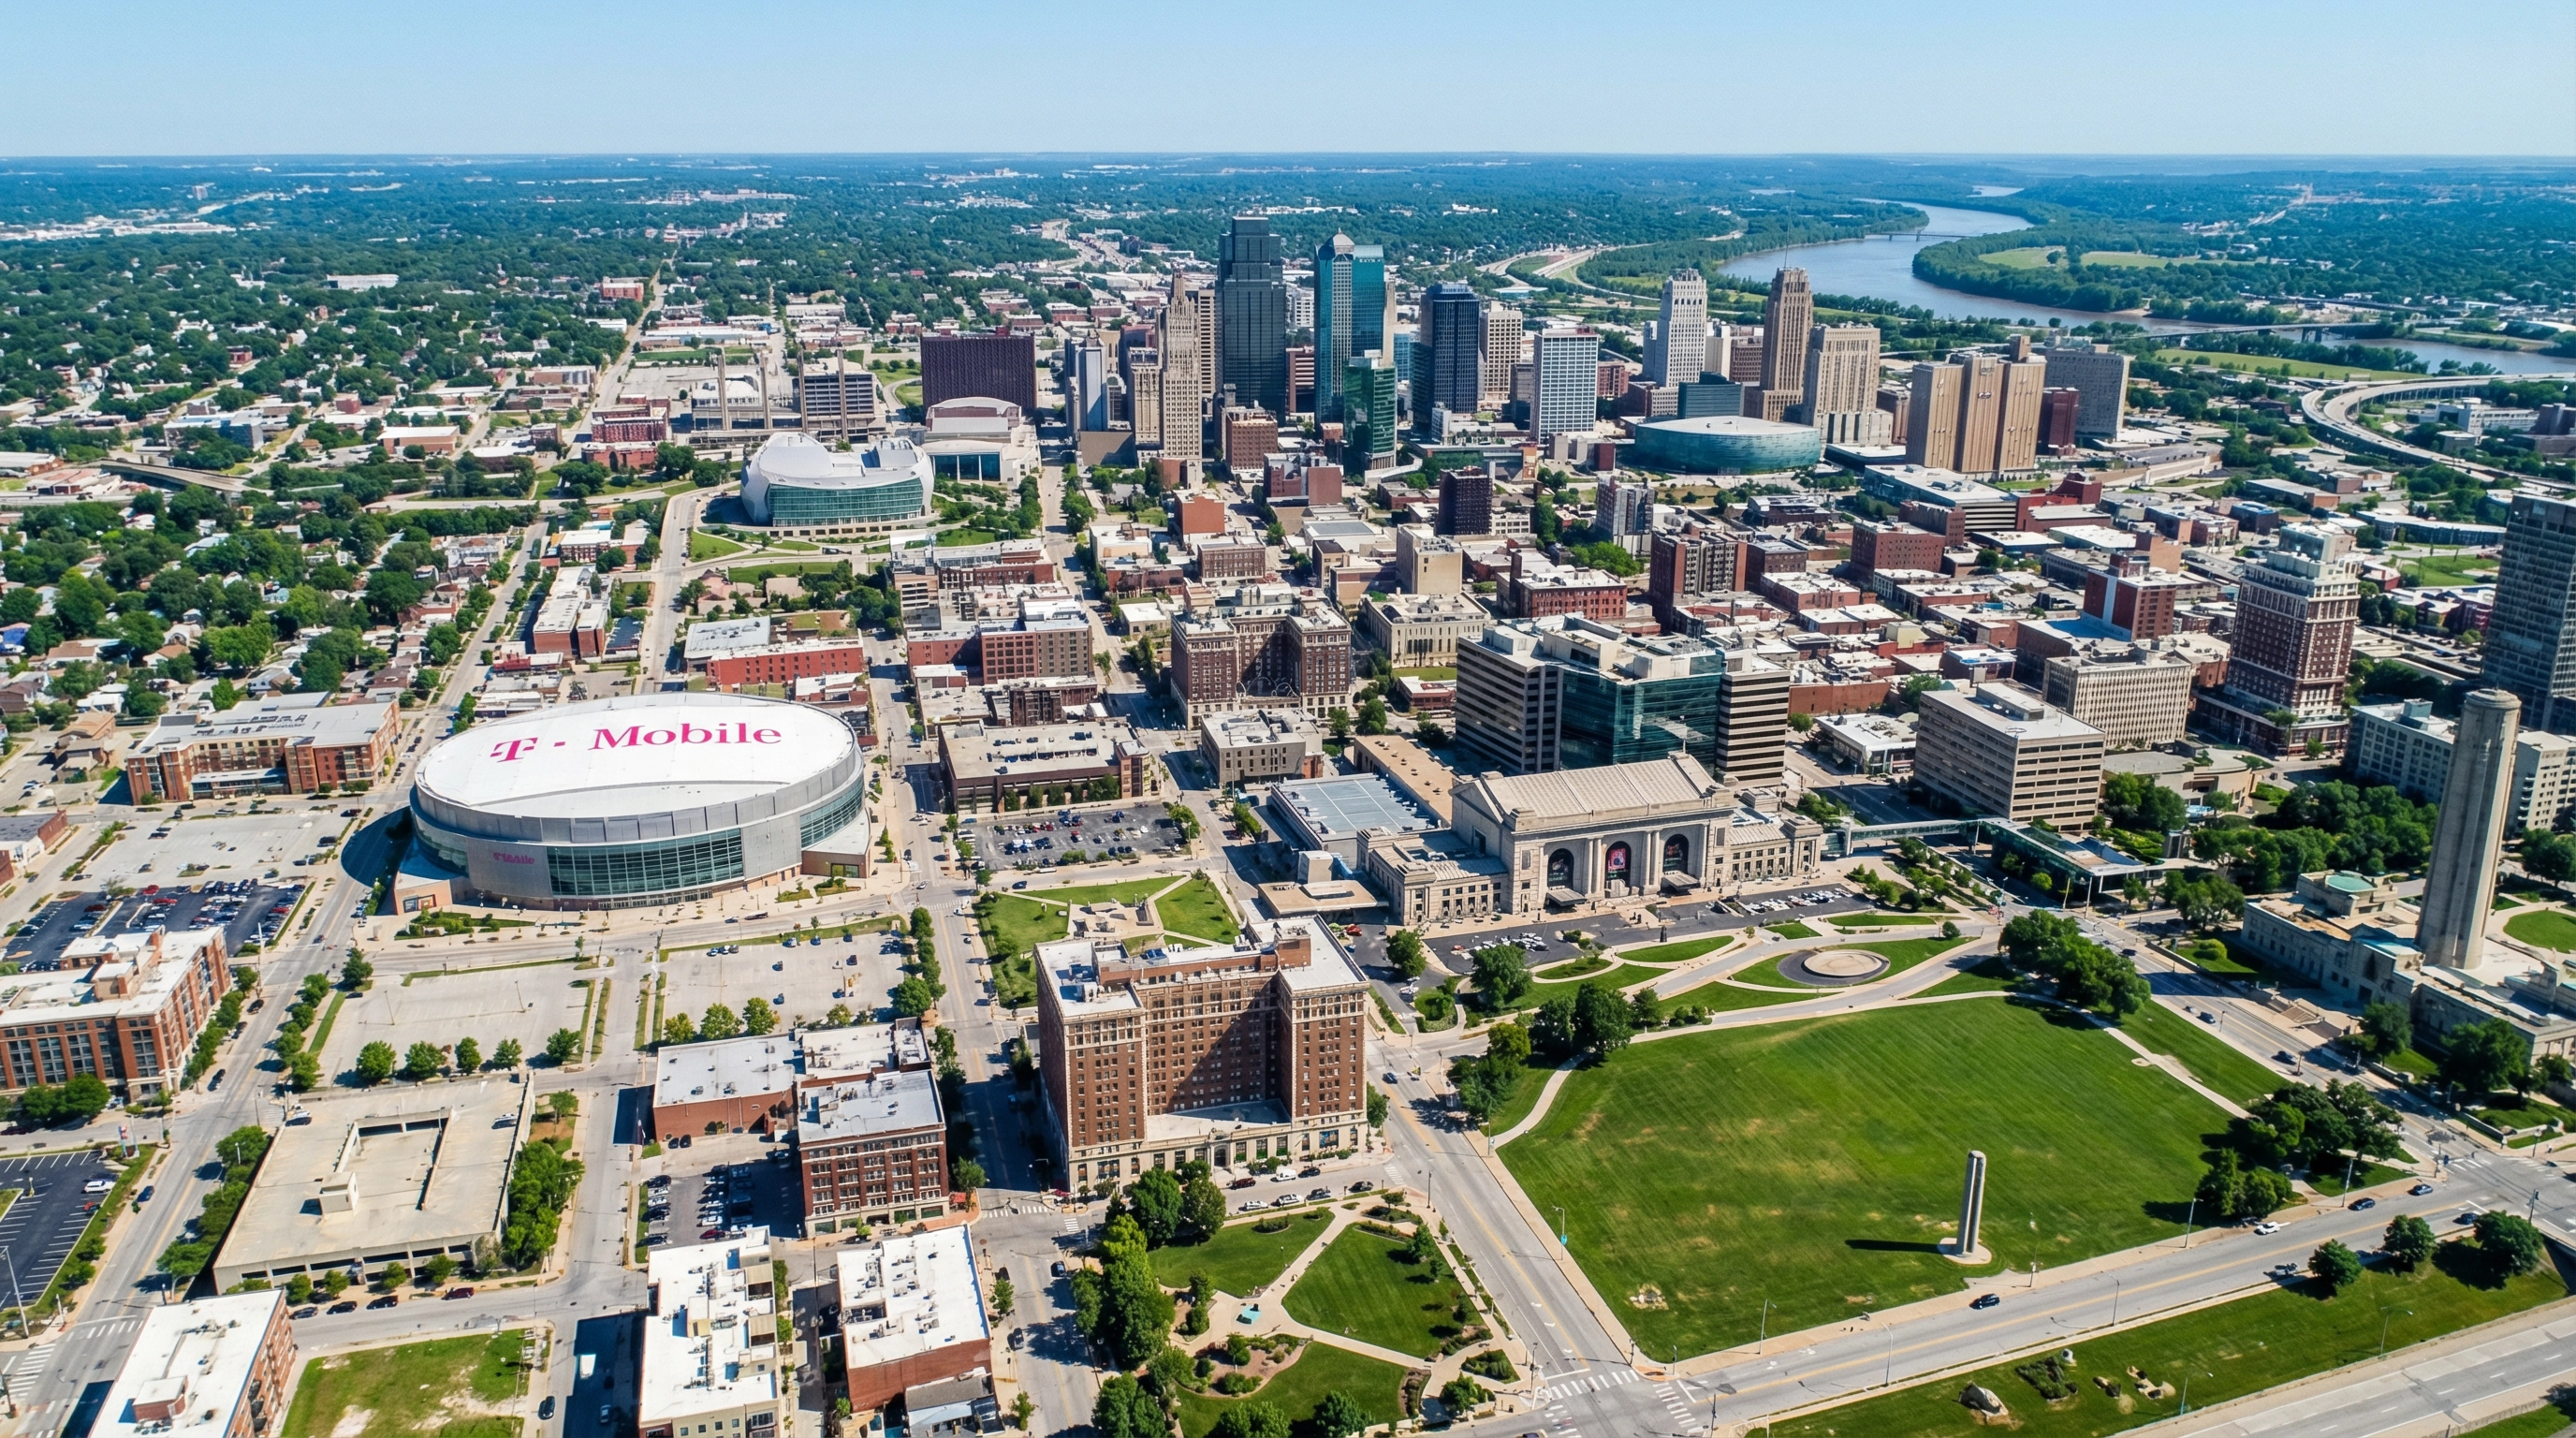
Kansas City Metro Overview
KC Metro
Market Fundamentals
Competitive Market Position
Executive Summary
Key highlights: 3.3% YoY rent growth, 7.2% average vacancy rate, 165,000+ total inventory units. KC outperforms national averages in affordability metrics. Strong job growth and population influx continue to drive demand.
Kansas City Metro Overview
KC Metro

Metro Economic Statistics
Q3 2025 Population GrowthSteady growth trend continuing through Q3 2025
METRO AT A GLANCE
Source: U.S. Census Bureau, Bureau of Labor Statistics, CBRE EA Q3 2025
Metro Economic Statistics
Emphasize the diversified economy with strong healthcare, logistics, and tech sectors. Unemployment remains below national average. Note the steady population growth of 1.2% annually.
Metro Statistics Continued
Highlight the $2.6B in recent development projects. Median household income growth outpacing inflation. Strong corporate relocations and expansions driving employment.
Kansas City Metro Overview
KC Metro
Submarket Inventory Analysis
Total Inventory by Submarket
Key Insights
- Central Kansas City represents the largest concentration of multifamily units (18% of metro).
- Johnson County (South JoCo, Olathe, Shawnee) commands the highest rents and strongest demographics.
- Northland is the fastest growing submarket for new development.
Deep Dive Analysis
Click any submarket for detailed demographics, competitive analysis, and investment highlights.
Source: CBRE Q3 2025
Submarket Analysis
Overview of 11 distinct submarkets across the KC metro. Each has unique characteristics - from urban core to suburban growth corridors. Johnson County leads in rent levels while Clay County shows strongest growth.
Kansas City Metro Overview
KC Metro
A Network of Neighborhoods
The greater Kansas City metro is separated into many unique and diverse communities which are also uniquely divided by the Missouri/Kansas state line.
Click to learn more information
Interactive Map
Interactive exploration of submarkets. Click any area for detailed metrics. Note the concentration of new development in Johnson County and South Overland Park areas.
Kansas City Metro Overview
KC Metro
Multifamily Market Fundamentals
MARKET SNAPSHOT
Source: CBRE EA Q3 2025
Year-over-Year Rent Growth (%)Source: CBRE EA Q3 2025 • Kansas City outperforming peer markets
Multifamily Statistics
Q3 2025 fundamentals show continued strength. Absorption positive for 8 consecutive quarters. Rent growth moderating but still healthy at 3.3% YoY. Vacancy ticking up slightly due to new supply.
Submarket Vacancy
Vacancy ranges from 5.8% (Urban Core) to 8.9% (Platte County). Class A properties seeing higher vacancy due to new deliveries. Class B/C remain tight with strong occupancy.
Submarket Rents
Average rents range from $1,144 (Clay County) to $1,634 (South Overland Park). Premium submarkets command 20-30% premiums. Rent growth strongest in emerging submarkets.
National Affordability Comparison
KC significantly more affordable than coastal markets. Cost of living index at 91 vs national 100. Housing costs 40-60% lower than comparable metros. Strong value proposition for relocating companies and residents.
Kansas City Metro Overview
KC Metro
Rent-to-Income Ratio: Kansas City vs. National Average
Kansas City maintains a significant affordability advantage over the national average
- Kansas City
- National Average
Rent-to-Income Trends
Rent-to-income ratio at 24% vs 30%+ in major coastal cities. Residents have more disposable income. This affordability advantage is a key driver of in-migration from higher-cost markets.
Rent vs Own Analysis
Monthly rent vs mortgage comparison shows renting remains attractive in current rate environment. At 6.25% mortgage rates, renting saves $1,320/month on average. This supports continued rental demand.
Kansas City Metro Overview
KC Metro
Kansas City Economics
Kansas City ranks among the most affordable major metros with average rents 37% below national average. This affordability advantage, combined with 3.3% rent growth, creates compelling investment opportunity.
Rent Affordability (2020-Q3 2025)Rent as % of Monthly Income
KANSAS CITY AFFORDABILITY
Kansas City Economics
KC's economic fundamentals support sustained multifamily demand. Low cost of doing business attracts employers. Quality of life metrics rank highly nationally. Strong foundation for long-term investment.
Kansas City Metro Overview
KC Metro
Development Pipeline
Units Under Construction
Construction Trends
Development activity remains concentrated in the urban core and high-growth suburban corridors.
Development Pipeline
Current pipeline of 8,500 units under construction. Deliveries concentrated in Johnson County and Urban Core. Supply growth moderating from 2024 peak. Expect 3,200 units delivered in next 12 months.
Kansas City Metro Overview
KC Metro
Construction Pipeline
New multifamily development activity across Kansas City metro
PIPELINE SUMMARY
By Status
Source: CBRE Q3 2025
Units Under Construction by SubmarketTop 10 submarkets by pipeline volume
Construction Pipeline Detail
Detailed breakdown by submarket and project phase. Note the shift toward suburban locations. Construction costs up 15% limiting new starts. Pipeline should normalize by 2026.
Kansas City Metro Overview
KC Metro
Kansas City Developments
Billions in new investment transforming the region
KCI New Terminal
$1.5BSingle terminal, 12M passengers annually
Completed 2023Panasonic Energy
$4.0BEV Battery Plant in De Soto
Under ConstructionKC Streetcar Extension
$350M3.6-mile extension to UMKC
Under ConstructionMeta Data Center
$800MGolden Plains Technology Park
Under ConstructionU.S. 69 Expansion
$300MExpress toll lane project
Under ConstructionBuck O'Neil Bridge
$220MU.S. 169 bridge replacement
Completed 2024Momentum
"Kansas City is experiencing a generational wave of investment, from infrastructure to technology, positioning the region for decades of growth."
Kansas City Developments
Major developments reshaping submarkets. Downtown revitalization continues. Johnson County remains premier suburban market. Watch emerging growth in Northland and East Jackson County.
Economic Developments
$117B+ in economic development projects across 6 metro counties. Major investments include Panasonic $4B EV battery plant, Project Kestrel $100B data center campus, CPKC Stadium District, and Lambda AI Factory. These projects will create 36,000+ jobs and drive sustained multifamily demand.
Kansas City Metro Overview
KC Metro
TOP REASONS TO INVEST
CENTRAL US LOCATION
Kansas City's geographic position at the heart of America provides unparalleled access to major markets and distribution networks.
STRONG CORPORATE BASE
Home to major Fortune 500 companies and diverse economy spanning healthcare, logistics, and financial services.
LOW COST OF LIVING
Housing costs 58% below national average, attracting young professionals and families seeking affordability.
SUPERIOR INFRASTRUCTURE
Six Class I railroads, major interstate highways, and new $1.5B airport terminal enhance connectivity.
EXCEPTIONAL EDUCATION
Top-tier universities and community colleges provide skilled workforce pipeline for growing industries.
RICH CULTURE & QUALITY OF LIFE
World-class BBQ, jazz heritage, professional sports, and vibrant arts scene create exceptional livability.
The Heart of America
Kansas City's multifamily market demonstrates strong fundamentals with exceptional affordability and steady rent growth. As one of the most affordable major metros in the nation, Kansas City offers investors a compelling combination of stable returns and growth potential.
Why Kansas City
Central US location provides logistics advantages. 4 major interstates, international airport, rail hub. Strong corporate presence with 10 Fortune 500 companies. Low cost of living with high quality of life.
Kansas City Metro Overview
KC Metro
Food & Beverage
Global Industry Leader
Kansas City is a global hub for the food and beverage industry, home to more than 600 food-related companies. The region's central location and agricultural heritage make it an ideal base for manufacturing, processing, and distribution.
Major Employers

Healthcare & Life Sciences
A rapidly growing sector anchored by the KC Animal Health Corridor, representing 56% of total worldwide animal health, diagnostics and pet food sales.
Food & Beverage Leadership
KC is a national leader in food & beverage industry. Home to major operations for Cargill, Dairy Farmers of America, and numerous craft breweries. This sector provides stable employment base.
Kansas City Metro Overview
KC Metro
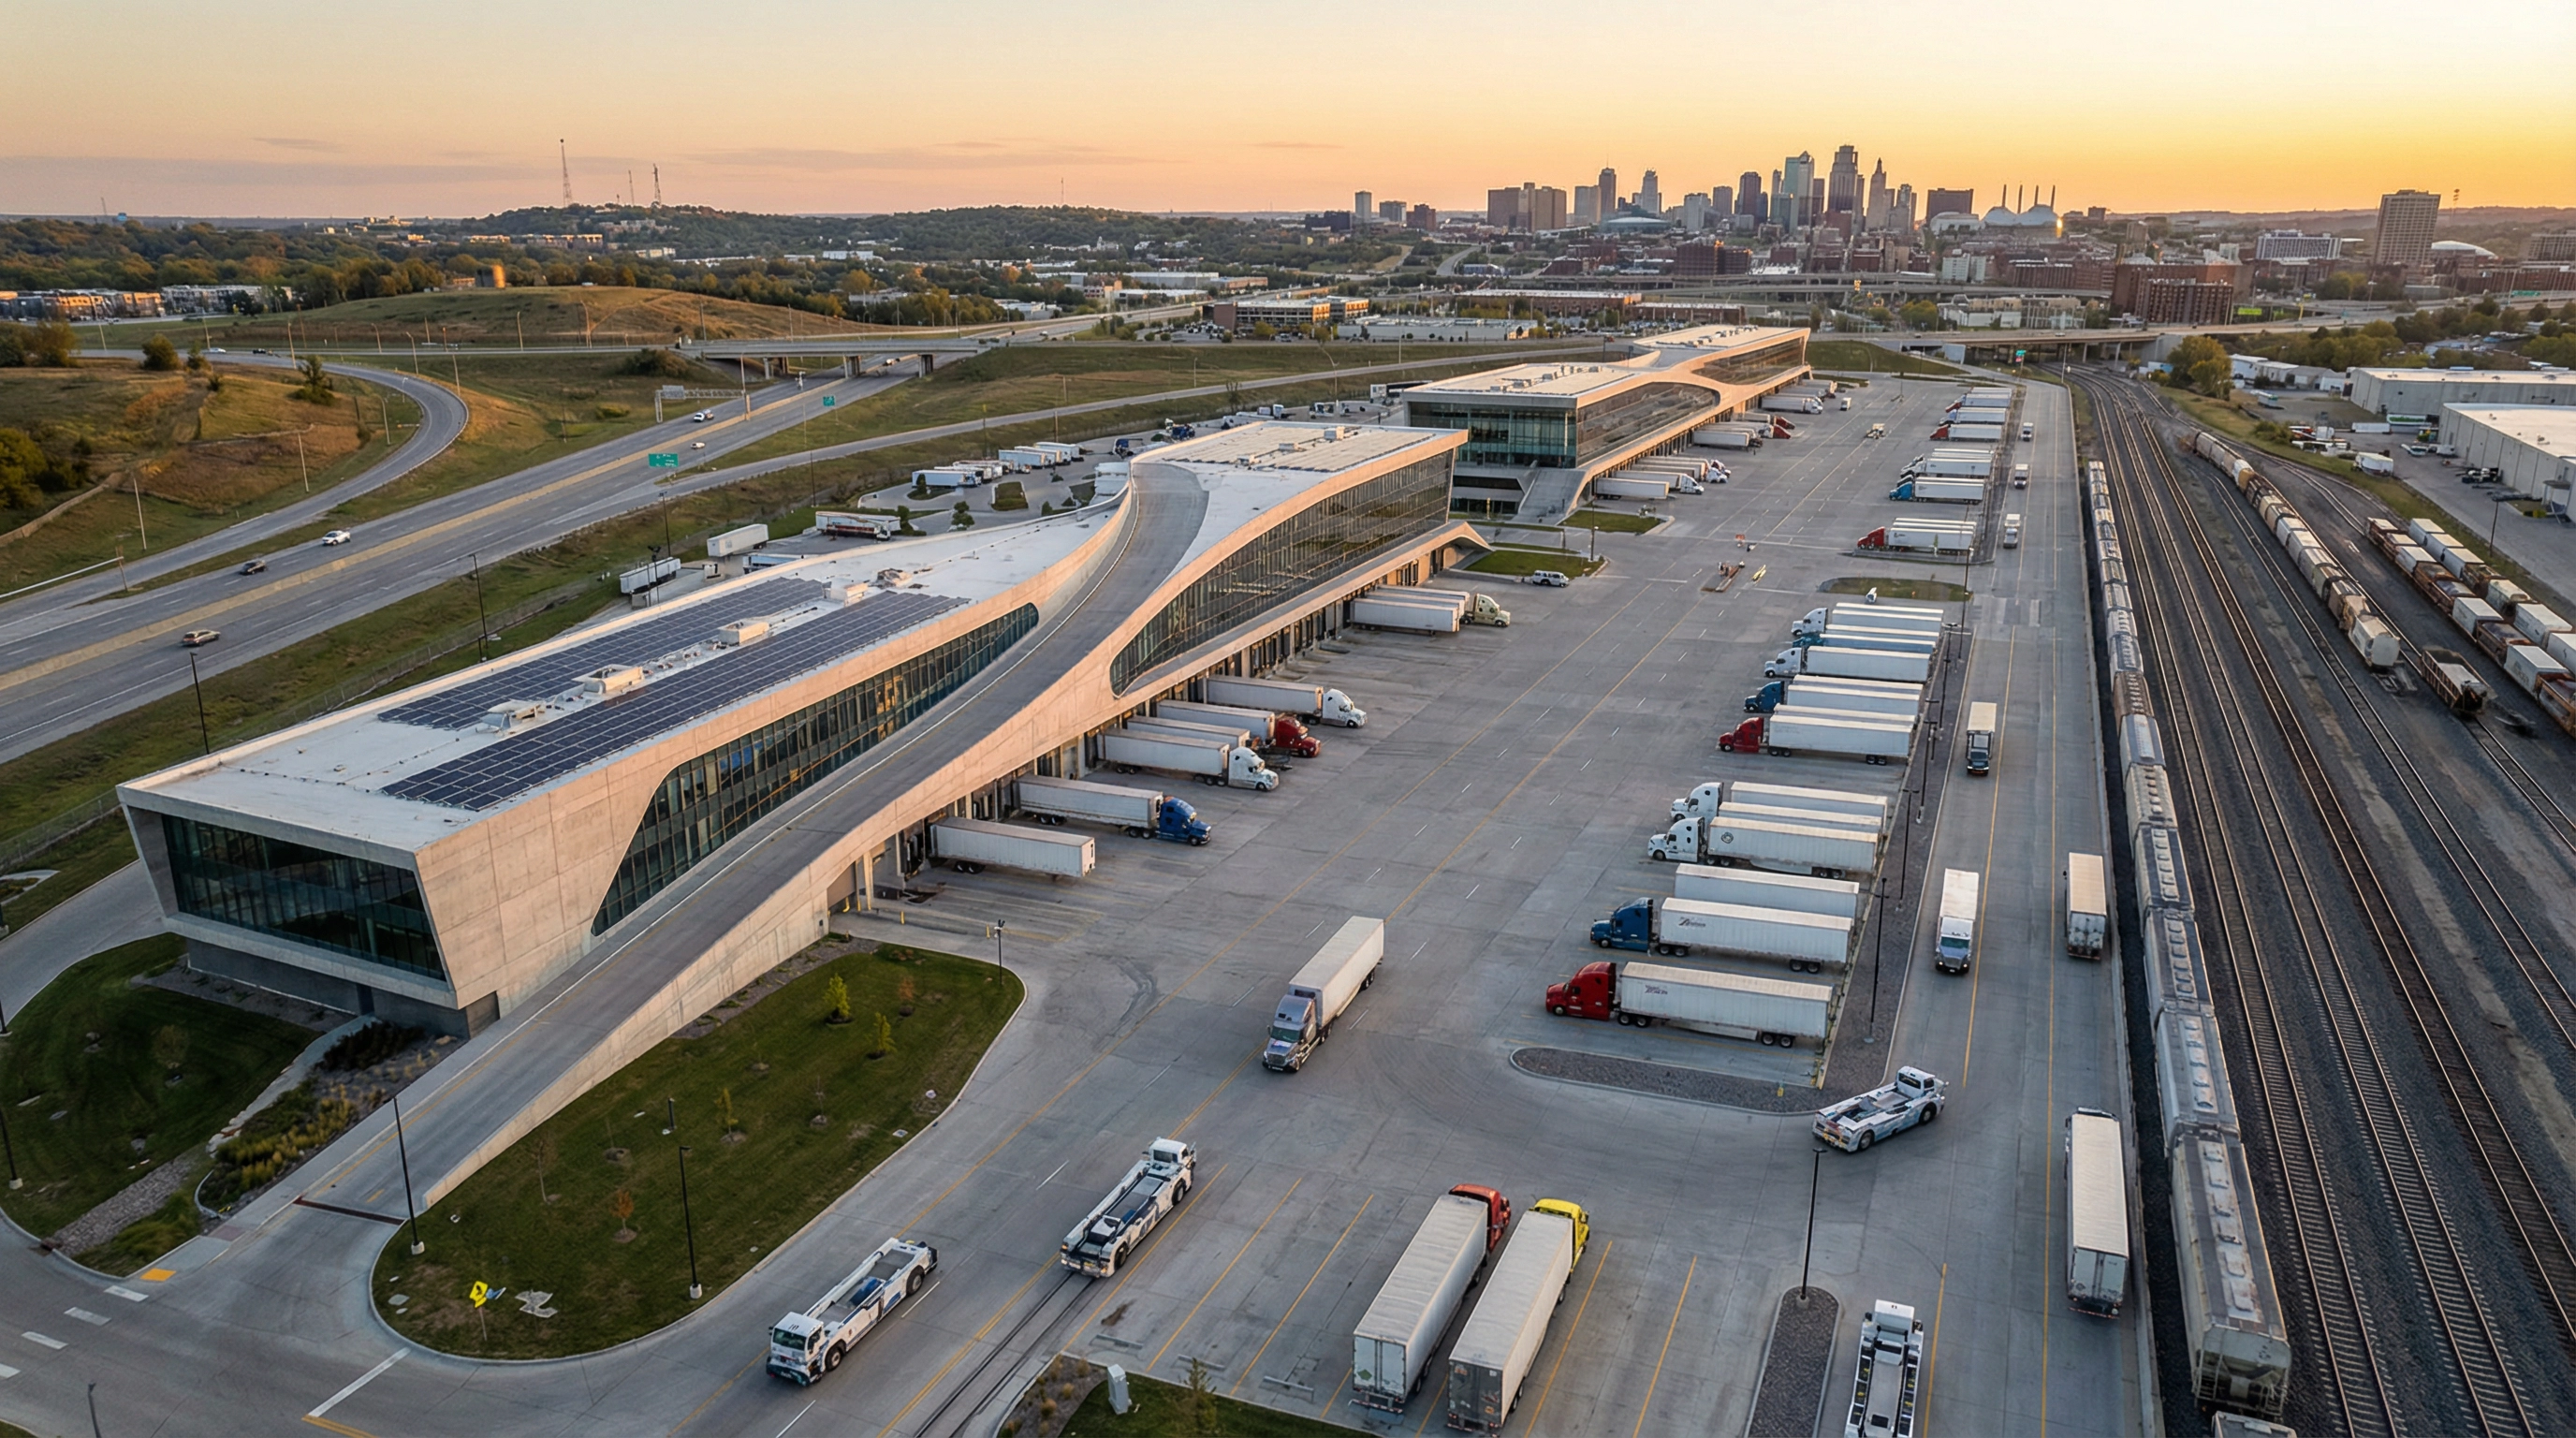
Logistics & Transportation
Kansas City is the largest rail center in the U.S. by tonnage and the intersection of four major interstate highways, reaching 85% of the U.S. population within two days.
Largest rail center in the U.S. by tonnage, served by 4 Class I railroads.
I-35, I-70, I-29, and I-49 providing N-S and E-W connectivity.
Single-terminal KCI airport opened in 2023, 12M passengers annually.
U.S. population reachable within 2 days by truck.
Logistics Leadership
Strategic location makes KC a logistics powerhouse. Within 250 miles of 85% of US population. Major distribution centers for Amazon, FedEx, UPS. E-commerce growth driving warehouse expansion.
Kansas City Metro Overview
KC Metro

Top Rated Education
Talent Pipeline
The Kansas City region is home to numerous top-tier universities and colleges that provide a steady stream of skilled talent to the local workforce. With a focus on engineering, healthcare, and business, these institutions drive the region's economic growth.
in 4-Year Colleges
© 2024 CBRE, Inc.
| Institution | Enrollment | Location |
|---|---|---|
| University of Kansas | 28,000+ | Lawrence/Overland Park |
| UMKC | 16,000+ | Kansas City, MO |
| Kansas State University | 20,000+ | Manhattan/Olathe |
| Park University | 11,000+ | Parkville |
| Rockhurst University | 3,000+ | Kansas City, MO |
| Johnson County CC | 18,000+ | Overland Park |
Top Rated Education
Strong educational institutions provide talent pipeline. KU, UMKC, K-State all have metro presence. 87,000+ students enrolled in 4-year colleges. Medical and engineering programs feed local employers.
Kansas City Metro Overview
KC Metro
KC Metro Talent
Diverse, skilled workforce driving economic expansion
Total Employment (Thousands)
Major Employers
"Kansas City's workforce is characterized by a strong work ethic, high education levels, and Midwestern values."
KC Metro Talent
Skilled workforce across multiple industries. Healthcare, tech, and finance sectors growing. Competitive wages with lower cost of living equals higher purchasing power for residents.

Live, Work, Play
Quality of life is a major draw. World-class BBQ and dining scene. Professional sports teams (Chiefs, Royals, Sporting KC). Vibrant arts and entertainment districts.
Kansas City Metro Overview
KC Metro

Metro Hot Spots
Power & Light District
Premier entertainment district with 50+ bars, restaurants, and shops.
Country Club Plaza
Historic 15-block district featuring Spanish architecture and high-end retail.
Crossroads Arts District
Creative hub with galleries, studios, boutiques, and award-winning dining.
River Market
Historic riverfront neighborhood with the region's largest farmers market.
Westport
Kansas City's original entertainment district with vibrant nightlife.
Union Station
Restored 1914 landmark featuring museums, theater, and transit hub.
Quality of Life
Short commute times, green spaces, family-friendly communities. Healthcare access excellent with major hospital systems. Safe neighborhoods with strong community engagement.
Kansas City Metro Overview
KC Metro
National Recognition
Best City for Remote Workers
Icelandair, 2021
Best Cities for Jobs
Glassdoor, 2020
Best City for High Paying Jobs
Glassdoor, 2021
Best Cities for Young Professionals
Niche, 2023
Best Cities for First-Time Homebuyers
SmartAsset, 2022
Best Places to Live
U.S. News & World Report, 2023
Best City for Tech Growth
CompTIA, 2022
Most Affordable Cities
Realtor.com, 2023
© 2024 CBRE, Inc.
KC Rankings & Awards
National recognition: #1 Best City for Remote Workers, Top 10 Best Cities for Jobs, #3 Best City for High Paying Jobs. These rankings drive continued in-migration.
Kansas City Metro Overview
KC Metro
National Recognition Detail
Best City for Remote Workers
Based on internet speed, cost of living, and quality of life.
Best City for High Paying Jobs
Comparing median base salary to median home value.
Best City for Tech Growth
Measuring tech job postings and employment growth.
Best Cities for First-Time Homebuyers
Analyzing affordability, market stability, and livability.
Most Affordable Cities
Among the 50 largest U.S. metros.
Best Places to Live
Based on value, job market, quality of life, and desirability.
Additional Rankings
More accolades: Top 5 Best Cities for Young Professionals, #10 Best Cities for First-Time Homebuyers. KC consistently ranks highly across quality of life and economic metrics.
2025 Team Transactions
CBRE Kansas City team's 2025 closed transactions. Highlight total volume, deal count, and key transactions. Emphasize market leadership and execution capability.
Top 10 Buyers - 2025
Top 10 buyers in Kansas City multifamily market for 2025. Note the mix of local and national investors. Total transaction volume exceeds $700M across these buyers. Demonstrates strong institutional interest in KC market.
Top 10 Sellers - 2025
Top 10 sellers in Kansas City multifamily market for 2025. Mix of value-add exits and portfolio repositioning. Blackstone's activity signals continued institutional liquidity in the market.
Top 10 Property Owners
Top 10 property owners by estimated portfolio value. Price Brothers leads with $1.6B portfolio. Note the strong presence of local developers alongside national REITs. These owners control 30,000+ units.
Single-Family Home Price Trends
Home prices surged 34% from 2020-2025, with peak growth during pandemic years. Current growth has moderated to 2.0% YoY, but cumulative appreciation far outpaced wage growth, creating affordability barriers that support multifamily demand.
Housing Inventory Trends
Inventory collapsed 52% during pandemic to historic low of 2,000 homes in Dec 2021. While recovering 184% to 5,672 homes by Dec 2025, inventory remains concentrated in higher price points, limiting entry-level buyer opportunities.
Rent vs. Own Cost Analysis
Renting saves $1,286/month compared to owning median home ($2,700 vs $1,414). Upfront cost difference of $66,500 (down payment vs deposit) creates structural advantage for renting. This cost barrier supports sustained multifamily demand.
Affordability Impact on Multifamily Demand
Four key drivers: 1) 34% price appreciation barrier, 2) Elevated mortgage rates (6-7%), 3) Limited entry-level inventory, 4) Demographic preferences. These factors validate continued institutional investment in KC multifamily through medium term.
Kansas City Metro Overview
KC Metro

Kansas City Metro Overview
Comprehensive Market Analysis
Investment Sales Team
CBRE
© 2025 CBRE, Inc. All rights reserved.
Contact Information
Thank you for your time. Happy to answer questions about specific submarkets, investment opportunities, or market trends. Contact information provided for follow-up discussions.
Kansas City Multifamily Market Overview | Q3 2025 | CBRE Econometric Advisors
38 Slides | Generated 4/19/2026